Gavagai Monitor Tutorial, Part 4: Exploring
This is a basic tutorial series for using Gavagai Monitor.
Explore your Targets
When your targets have been active for some time and collected data, you can start exploring them. If you still have to wait for them to gather documents, you can check out one of the sectors from the "Examples" menu.
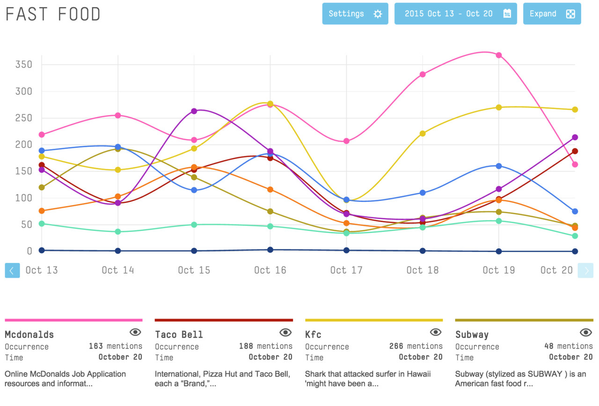
Click on one of your targets or sectors, or use one of the examples available from the "Examples" context menu to start exploring. You should see a plot of the collected data, along with some other information, such as target names and options.
- In this view, click on a data point on the graph and the option "Click here to explore" will show beneath each target (if you are not looking at a sector, there will only be one target).
- Click on it and the documents this target has gathered for the given data point will be presented to you.
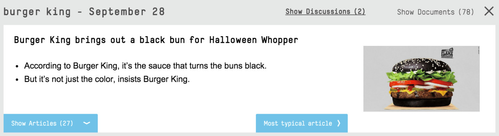
- If available, you will be provided with summaries of what people discussed about the target for the given time frame. If there are no discussions available, you will instead see a list of documents that were matching the target's target terms.
- You can switch between discussion summaries and the list of documents by clicking on "Show Discussions" and "Show Documents" respectively (in the top right of the frame).
- When looking at the discussions, you can access the documents it is based on by clicking on "Show Articles", or you can go directly to a representative result by clicking on "Most typical article".
- When viewing the list of documents, you can either filter them by domain by clicking on "Filter on domains", or display an unfiltered list with all documents by clicking on "Show all".
If you want to make changes to the resolution and the way of displaying your targets, you can change the standard view by clicking on the different options on the top right corner of the plot.
Settings 
- Plot (only in sector view): Change between "Targets" and "Key Subjects" to plot your targets or key subjects respectively.
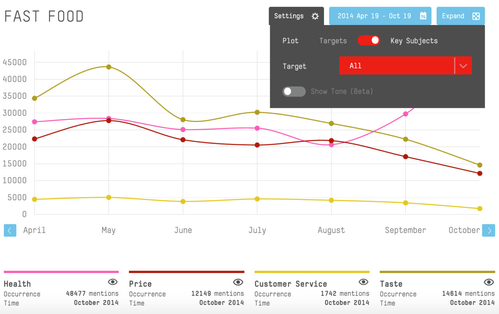
- Key Subject (only in sector view): Choose a key subject from the drop-down menu to apply it to your targets, so only results that match both the target's and the key subject's configuration will show. If the previous option is set to "Key Subjects", targets and key subjects will be inverted, and your targets will be shown in this list.
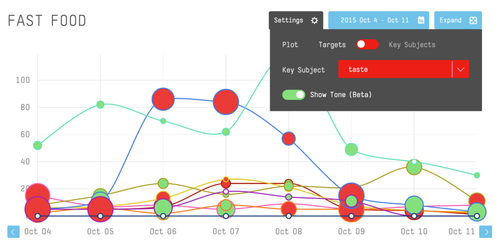
- Show Tone: This will label the data points in the plot either positive (green) or negative (red). The bigger the dot, the stronger the sentiment.
Time Frame and Resolution 
- Date: Click on the date or the calendar to select a date to view. Navigate through the months using the arrow buttons and choose a day by clicking on it.
- Day: Changes the resolution of the plot to day resolution. Each data point represents a time frame of one hour (e.g., a data point at "10:00" represents the time frame 10:00:00 - 10:59:59).
- Week: Changes the resolution of the plot to week resolution. Each data point represents a time frame of one day (e.g., a data point at "Oct 15" represents the time frame October 15th, 00:00:00 to October 15th, 23:59:59).
- Month: Changes the resolution of the plot to month resolution. Each data point represents a time frame of one day (e.g., a data point at "Oct 15" represents the time frame October 15th, 00:00:00 to October 15th, 23:59:59).
- 6 Months: Changes the resolution of the plot to 6 months resolution. Each data point represents a time frame of one month (e.g., a data point at "October" represents the time frame October 1st, 00:00:00 to October 31st, 23:59:59).
Expand 
- Expand: Expand the image to fit your browser.
You can hide single targets from the plot by clicking on the ![]() next to their name. This can be useful if some of your targets collect much more data than the others.
next to their name. This can be useful if some of your targets collect much more data than the others.
No data to explore?
If you don't want to wait for your targets to gather data, if you want to take a look at a certain date before you signed up, or if you simply need an update of your old data because you changed its target terms or filters, we can collect historic data for you. This process is called a replay. Depending on the language, we can easily gather historic data for up to a year back in time.
- Click on a sector or target.
- Locate the
 button below the plot and click on it.
 - You will see two columns with targets. On the left side are your "Available Targets", on the right side you can see your targets "Selected For Replay". Click on a target's name to move it from one column to the other.
- Click on "Send Request" to confirm your choices.
- A member of our team will get back to you on the details of the replay.
Under normal circumstances we can deliver replays within a day. Depending on language and time frame, we might have to accumulate the necessary data first. In these cases, we will provide you with a time estimate.
Next Steps
- You can go to the next part of the tutorial series: coming soon
Related articles