Gavagai Explorer is a tool to analyze related texts to find common topics, their associated terms, their sentiment scores and their prevalence in the data (number of respondent mentions). Although the primary use case for Explorer is the analysis of open-ended survey responses, it can be used to analyze any set of related texts such as product reviews, Net Promoter Score programs, or social media opinions for a given target-of-interest.
Gavagai Explorer aims to give the analyst a comprehensive and quantified view of the unstructured input data. It identifies the main topics or themes, measuring their importance as a relative strength to the total number of texts. This means that the strength of a topic is comparable across different data sets.
This documentation introduces the main features of the Gavagai Explorer and guides you through using these features effectively.
1 Introduction
All of Gavagai's services are built on top of a core system called the Gavagai Living Lexicon, which continuously learns languages by ingesting newly published texts from the Internet. Through this process the lexicon learns about the vocabulary of the language and the relationships between words and multiword expressions. From this understanding we can extract useful information in our services. For more information about the Living Lexicon's website.
In Gavagai Explorer, you can see the effects of the Living Lexicon working in the background by looking for suggestions of related terms in each topic. Each suggestion is taken from the knowledge we have of relationships between words. You can also look for multiword expressions (like 'San Francisco') which are built automatically from the system’s general knowledge of language.
2 Getting started with Explorer
Gavagai Explorer is a web-based application that is best experienced using Google Chrome. You can download Chrome here.
2.1 Creating an account
You need to create an account with the Gavagai Explorer before you can start to analyze your texts.To get a free trial account, open this link in your browser: https://explorer.gavagai.se, click the ‘Try for free’ button and follow the instructions.
2.2 Creating a project
َTo start using the Explorer you need to first create a project. Add a new project by clicking on the ‘Create project’ button on the Explorer homepage.

When you press this button you will be redirected to a new page where you can give a name to your project and load your data. Write the name of your project in the text field. Note that you can edit the project name later in the project's 'Edit' page. Load the data to be analyzed by clicking the 'Choose file' button and select a file in a csv format (comma separated values to represent data in columns) or an Excel file (either .xls or .xlsx).
When you choose your target file, you will be redirected to the Explorer homepage ('My Projects') where you can see the list of your projects including the one you just created. Wait a few seconds until Explorer completes pre-processing your data and your project status turns to 'Ready'. You can then click the Explore button to start analyzing your data. The first time that you click Explore for a new project, you need to do a basic configuration and click Explore once more before Explorer analyzes your data.
2.3 Basic Configuration
You first need to specify the main text column that you want to explore. Note that if your file consists of more than one text column you are interested in exploring, you need to create a separate project for each of these columns. You also need to choose the language of your texts. When you select the text column, Explorer flags the language automatically.
2.3.1 Applying a Template Model – Optional
You can apply a model as a template to your project. In chapter 8 we explain how models are created and used in Gavagai Explorer.
2.3.2 Filter Conditions by Meta-Data – Optional
You may optionally set up some filtering conditions on values from other columns than your main text column. In the drop-down menu you will find those columns that are candidates for filtering - this means those columns that have a few different values repeated over and over, like ratings, or gender. Then you can choose which values are accepted for that column. After choosing the accepted values, save your settings by clicking on the ‘Add filter’ button.

You might apply filtering conditions to divide your data into smaller groups and analyze each group in Explorer independently; e.g. for employee’ reviews of a large company you might divide your data to company’s departments, or you might divide it into two group of males and females. You might also filter texts based on the level of respondents’ satisfaction by selecting specific values of ranks or ratings.
Another application of filtering columns is where you have very large amount of data which cannot be analyzed by Explorer at once. In this case, you may, for instance, filter data based on time periods (e.g. monthly basis).
When you are done with basic configuration, you can click on Explore to start analyzing your data.
2.4 Account Settings
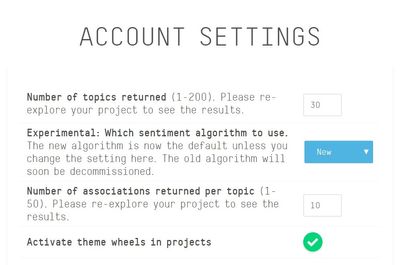
In Explorer you can specify different settings for your account. To change your account settings you can go to My Account page from Explorer homepage. Each time that you make changes to your account, the changes will be applied to all of your futures projects, as well as to your old projects next time that you click Explore for them. There are 4 different features that you can change the settings for them in Account Settings:
- Number of topics returned. Here You can specify the number of topics that you want the Explorer to return for each project. You can pick any multiple of 10 between 10 and 200, inclusive. Note that increasing the number of topics can decrease the speed.
- Which sentiment algorithm to use. Next you can choose between the two existing sentiment algorithms in Explorer. You can read more about each of these algorithms in section 4.3.1 .
- Number of associations returned per topic. You can specify the number of associations for each topic. You can select any integer number between 1 and 50, inclusive.
- Activate theme wheels in projects. Here you can activate and deactivate theme wheels for your projects.
3 Overview of the Gavagai Explorer GUI
...
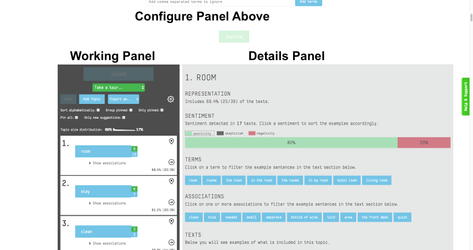
3.1 GUI Main Buttons
3.1.1 The Undo and Explore Buttons
The Gavagai Explorer GUI has two important buttons that you need to use continually when analyzing data with the Explorer. They are the ‘Undo’ and ‘Explore’ buttons. If you know how to use these buttons correctly, it will help you to analyze your data with Explorer more easily. The ‘Undo’ button can be found at the top of the working panel. For ease of access, the ‘Explore’ button has been placed in three different areas of the GUI; at the bottom of the configuration panel and at the top and bottom of working panel. Note that the functionality of all three of these buttons is the same.
3.1.1.1 Explore Button
Whenever you make changes in the working panel or configuration panel, these changes will not be applied until you press the ‘Explore’ button. Note that you can make several changes in both the working and configuration panels between each iteration and all of these changes are subsequently applied the next time you press ‘Explore’.
3.1.1.2 Undo Button
When you make changes in the working panel and before you press the ‘Explore’ button, Explorer will keep track of the current changes and provide you with an ‘Undo’ button that can be used to reverse changes in sequence. Keep in mind that you cannot automatically reverse the changes once you have pressed ‘Explore’ and moved on to the next iteration.

3.1.2 Pin Button
For each topic in the working panel, we have a pin button which is specific to that topic. When you pin a topic by pressing this button you tell Explorer that you want to keep it in the list of the topics regardless of its frequency. This is particularly relevant when you filter texts, remove terms or add data. Other important applications of pinning are when you create models from your existing projects (see chapter 8) or when you export the result of your analysis in a full MS Excel format (9.1 Save as Excel and Full CSV).
Explorer will also provide Theme Wheels for your 6 most frequent pinned topics (6 Explorer Theme Wheels).
3.1.3 Topic Scroll Button
For each topic we have a topic scroll button in the working panel (see the previous picture). When you press this button the Details Panel will automatically scroll to the selected topic.
4 Topics in Gavagai Explorer
Topics are the core of the text analysis in Gavagai Explorer. They are basically the main subjects in your data. For instance, in hotel reviews, topics like hotel, staff, room, restaurant, etc. are usually among main topics. In addition, there are usually another type of topics in the texts which are not related to a hotel in general but become a topic for one specific hotel because of the frequent mentioning by respondents. For example, if you have a data including hotel reviews and many of the respondents refer to many items in the hotel as great items (e.g. the hotel, the restaurant, their room, etc.) then “great” becomes a topic in your project. On the other hand, if many of the respondents complain about a specific issue in the hotel; e.g. renovations, then that issue also becomes a topic in your project.
Each topic in Explorer has a name and it includes one or more terms. The topic name is a label assigned by the system or the user for referring to the topic, while the terms are the actual words (or sequences of words) from the data that the topic is composed of. Each term can be included in only one topic. We say a document includes a topic if it includes at least one of the terms in that topic. Then, the frequency of a topic is defined as the number of documents that include that topic, divided by the whole number of documents.
Explorer finds the main topics in your data and it makes it possible for you to revise them. When you run explorer on a dataset for the first time, Explorer shows you the 30 most frequent topics throughout all the texts.
For each topic, Explorer considers a specific area for that topic in both working and Detail panel. We refer to the working and detail panels as simply the topic area. In addition, there is a blue box for each topic in the working panel which includes the name of the topic. We refer to this box as topic box. At the right side of each topic box, you can see the topic expander which contains two numbers. Here you can see the topic box and its expander for the topic “hotel” for data including hotel reviews.

The first number (in green) is the number of including terms in that topic and the second one (blue) is the number of suggestions (see next section). When you click on topic expander you can see the including terms and suggestions.
In the following, we explain the main elements in each topic and we guide you through revising them.

4.1 Terms in Explorer
4.1.1 An Introduction to Explorer language Capabilities
4.1.1.1 Paradigmatic Neighbors
Explorer searches for terms in your data with more complexity than a simple search engine. Let us explain by an example. Consider the word “income” in the following sentences:
Many people are dissatisfied with their income.
I can't get by on such a small income.
The company's gross income grew considerably this year.
The single most important measure of a company's profitability is net income.
Compensation is far below the market.
In the first two sentences, income has been referred to as a general term while in the two latter sentences the terms gross income and net income are specific types of income. In the last sentence, the word income is not present, but we have the word compensation which is a synonym of it. Words like income, net income, gross income and compensation are called paradigmatic neighbours. Paradigmatic neighbours are semantically related words which are used in text or speech for related objectives. Paradigmatic neighbours can be synonyms, like “income” and “compensation” in above examples. They can also be words that do not have same meanings but they are related in some way; e.g. “fork” and “spoon” which are both used for eating.
4.1.1.2 N-grams
An n-gram is a sequence of words which frequently appears in the same order in text or speech. Generally, it is important not to split n-grams as it might result in information loss. For instance, “water supply” is an n-gram consisting of two words “water” and “supply” while none of these words can define it individually. The word “San Francisco” is an n-gram which is different from both “San” and “Francisco”. Another capability of Explorer is to identify n-grams in your data and not split them. From now on, when we mention terms in this document we mean n-grams. The value of variable n is dependent on the corresponding language and it is usually between 1 and 3 or more.
4.1.2 Terms and suggestions
As mentioned, each topic can include one or more terms. Terms included in each topic are words that each can define that topic independently. Each term can belong to only one topic. For each topic, Explorer shows examples of texts including the terms in that topic. You can find them in explorer Detail panel. You can also filter the examples by clicking on specific term(s).
For the terms included in a topic, Explorer automatically finds their paradigmatic neighbours and shows them to you as Suggestions. You can see more suggestions by clicking on Get More button (figure to be added). When you hover over a suggestion in the working panel, a question mark will appear. You can see the examples of the texts including that suggestion by clicking on this question mark.
4.1.3 Adding and Removing Terms
4.1.3.1 Adding Terms
You can always expand your topics by adding new terms to them; either from Explorer suggestions or as your own input. To add terms, you need to open terms and suggestion by clicking on topic expander. Then you can write your terms in the text box and click on Add words. You can also search for terms in the same text field. The search has auto-complete capability. You can also add terms by accepting suggestions from Explorer. To see more suggestions, you can click on Get More button.

Note that a term including in one topic might appear in the suggestions of another topic. For instance, consider the the topic income including the terms “income”, “salary” and “salaries” and the topic compensation including the terms “compensation” and “compensations”. Since the two words compensation and income can be used interchangeably in the same contexts, you see the term “compensation” as a suggestion for the topic income.

And

In this case, if you choose to accept compensation for the topic income, Explorer will merge the two topics automatically (read more about merging in 5.2.3 Merging Topics). This is basically because the terms in each topic are assumed to be synonyms (so if two terms in two different groups are synonyms then all terms in that groups are synonyms). In figure below you can see the new topic income after automatic merging. The topic compensation will become disabled. The next time that you press Explore, you will see the new statistics for the new topic income and the topic compensation will be removed from the list.
4.1.3.2 Sticky Synonyms
When you accept a suggestion for a topic in a project, the connected terms are saved in your account (sticky synonyms), and they are automatically applied in new projects; which means the previously accepted suggestions are automatically added in your new project.
4.1.3.3 Removing Terms
You can remove terms from topics by clicking on them in the working panel. When you remove a term, you might still see it in the list of suggestions of other topics and therefore you can add it to them. Note that when you remove a term from a topic, Explorer automatically pins that topic so that you would not lose the topic in the list of topics in case the topic becomes infrequent.

You can also ignore a term from all of your topics by writing it in the text box under Ignore Terms in configuration panel and pressing add term (previous figure). When you remove a term, Explorer ignore it in your analysis, however, note that texts including that term are still available for contributing to the topics.
4.2 Associations
For each topic, Explorer finds the words that are tightly connected to the terms in that topic, and shows them to you as Associations. By tightly connected we mean words that appear together repeatedly and closely in the same sentences in different texts. For each topic, the list of associations to that topic can be found under the topic box. You can also find the frequency of each association with respect to that topic in front of it. Associations are ordered in the association list based on their frequency and also their closeness to the topics.
Associations can give you a better understanding of the topics. For example, consider the topic “the restaurant” which is a frequent term in a hotel reviews data set. As you see, the terms “closed”, “renovation” and “under construction” are tightly connected to this topic which means most respondents are complaining about renovations when they mention restaurant in their responses.
You might have noticed that the term “breakfast” is at the bottom of the list although it is more frequent in the topic comparing to the upper terms. This is due to the fact that both frequency and closeness are taken into account in the process of listing the associations.

For any subset of the set of terms and associations of a topic, you can filter the texts examples that contain all the words in that subset. You only need to click on them in the detail panel to filter texts.↓

4.3 Sentiment Analysis
Gavagai Explorer applies word based or lexical based sentiment analysis principles to quantify the sentiments behind expressed opinions. In the Details Panel, you can see the quantity of three basic sentiments for each topic or group; that are Negativity, Positivity and Skepticism (next figure). When you filter texts by selecting terms and associations in the details panel, the sentiment values will be updated as well. When you export the result of your analysis into excel, you can see 8 sentiment values for each single text (see 9.1.2 Sentiments). You can also select one or multiple topics for sentiment analysis when you export. This will give the sentiment scores for your selected topics in the report (see 9.1.5 Sentiments Per Topic). Moreover, you can model your own sentiments by using Explorer Concept Modeler and then Explorer will analyze your data for these Concepts (read more in 7 Explorer Concept Modeler).

4.3.1 More about Sentiment Analysis in Explorer
4.3.2 The Sentiment Scoring System
The room was good. Has a 1 for Sent: Positivity.
The room was really good. Has a 2 for Sent: Positivity.
The room was not good. Has a 1 for Sent: Negativity.
4.3.3 The Sentiment Bar in the Web Application
4.3.4 The Sentiment Analysis Algorithms that Determine the Score
- The room was good and the staff are bad.
- The room was good and the staff are bad.
4.4. More about n-grams in Explorer
Now that you have learned about topics, topic terms and sentiment analysis, it is worth learning a bit more about n-grams in Explorer as well. As mentioned before, n-grams are topic terms including multiple words, for example "San Francisco". Explorer identifies n-grams in your data and show them to you as topics if they are enough frequent. You can also add n-grams to your topics manually. The most important characteristics of the n-grams is that they are treated as one single entity, and therefore, the uni-grams included in an n-gram cannot contribute to topics individually. This is the case for both topic counts and sentiment analysis. As an example, suppose that you have an n-gram "junk food". Also assume that you have a topic FOOD which includes "food" as a topic term but not "junk food" as a topic term. Now for the sentence "I don't like junk food at all", for Explorer the topic FOOD is not included in this sentence because of "junk food" being a bi-gram.
5 Revising Topics
In this section, it is explained how to revise your topics by Explorer according to your assumptions and needs.
5.1 Adding and Removing Topics
5.1.1 Adding Topics
...
You can add topics by clicking on the Add Topic button in the top of the working panel. When you click on this button, Explorer considers a new topic area for it at the top of the list. Here you can give a name to your topic, and you can add terms to your topic by writing them in the text box and clicking on Add words. When you are done, click on Remove me after adding words.
Note that the name of the topics are only labels that are assigned to them, and therefore each topic should have at least one term. Terms are the exact words the Explorer actually keeps track of in your data. You cannot add a term which is already included in another topic. The new topics are automatically pinned, so Explorer keeps them in the list regardless of their frequency.
Keep in mind that Explorer does not add these new topics to your analysis until you have pressed the 'Explore' button.

When you add new topics to your project and press Explore, Explorer starts re-analyzing data and it inserts new topics into the list of topics in order of their frequency. Then, you can see the information about associations, suggestions and statistics for new topics.
Note that Explorer does not remove any topics from the list when you add new ones.
5.1.2 Removing Topics
You can also remove a topic from your analysis if you find it unimportant for your project. Hover over that topic in the working panel and click on cross button to remove the topic.
Explorer will ignore the topic when you remove it from the list, however, note that texts including that topic are still available for inclusion in other topics. The terms including in each topic are saved in configuration panel under the Ignored Terms, and you can have them back at any point by clicking on them.

5.2 Grouping and Merging Topics
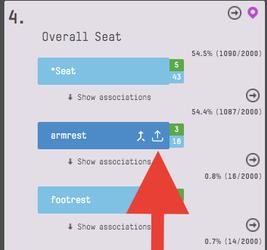
5.2.1 Select button
When you hover mouse over a topic in the working panel, an upwards arrow appears inside the topic box which is called Select button. You select a topic by clicking on this button. When the topic is selected, the topic blue box turns to orange. You can also deselect the topic by re-clicking on this button.

In Explorer, both merging and grouping should start with selecting a topic. In the following it is explained how we can merge and group topics by Explorer.
5.2.2 Grouping Topics
5.2.2.1 Intro
If you find some topics to be in the same category you can put them in one group. This will give you a more organized working panel. In addition, Explorer will tell you about the sentiment and statistic of the whole group.
For instance, for the hotel reviews, you might like to put all the words about food (e.g. breakfast, coffee, wine, etc.) in one group called Food. Explorer shows you the number of the respondents that have written about food (frequency of the whole group). It also shows you the aggregate sentiments of this group, so it wil let you know if the respondents are positive or negative about food on the whole.
5.2.2.2 How To Group
Grouping topics in Explorer starts with selecting one single topic by clicking on Select button. When you click on this button, a down arrow button will appear in the left side of each topic or group. We refer to this button as Group button. You can place the selected topic into a target group by clicking on this button. By default, the name of the group will be the name of the target topic (or group). You can change this name by re-writing it in the working panel.

5.2.2.3 Statistics
After re-exploring data by Explorer, grouped topics are inserted into the list of the topics in order of their aggregate frequency (which is the number of distinct texts that include at least one of the topics divided by the whole number of topics). This value can be found in both working and detail panel under the group name. In the detail panel and under each group name, you can also find the aggregate sentiment of that group. The frequencies, sentiments, associations and suggestions for single topics can be found under their names like before.
5.2.2.4 How to Ungroup
You might want to take a topic out of a group. You can click Undo button at the top or click the ungroup button. Note that the topic you ungroup from a group will be automatically pinned. You should update and save after.
5.2.3 Merging Topics
5.2.3.1 Intro
...
5.2.3.2 How to merge
Similar to grouping topics, merging topics starts with selecting a single topic. As before, you select the topic by clicking on the Select button in the topic box. When the topic is selected, an upwards arrow button will appear at the left side of all other topics. We call this button as Merge button. You merge the two topics by clicking on the Merge button for the second topic. By default, the name of the merged topic will be the name of the first selected topic. You can change this name by re-writing it in the topic box.

6 Explorer Theme Wheels
As mentioned before, Explorer represents an statistical visualization of your first 6 pinned topics (or groups) by Explorer theme Wheels. At the top of each theme wheel, you can find the name of the corresponding topic. The frequency of the topic can be found in the center of the wheel. The pieces of the wheel are the four most frequent associations of the topic. If you hover over a piece you can see the frequency of the corresponding association inside the topic.

Here you can see the theme wheel regarding the topic “room” in hotel reviews. The topic has a frequency of 75.4% in the data and its most frequent associations are “great”, “clean”, “comfortable”, and “staff” respectively. The frequency of “great” as an association of “room” is 39.8%. This means that almost 40% of the people who have mentioned room in their responses have found it great.
7 Explorer Concept Modeler
Concept Modeler is a tool for additional analytics in Gavagai Explorer. You can define different concepts in Explorer and then analyze you data with respect to them. Same as models, concepts are independent from projects and one concept can be used in different projects. A concept is defined by its including terms. In contrast with topics, the including terms in a concept do not need to be synonyms or semantically similar terms, but they are elements that jointly define that concept. Let’s give an example.
In Hotel Reviews you might define a topic called breakfast, including the terms “breakfast” and “the breakfast”. Each of these terms that appear in a text we will know that the topic breakfast is included in the text. Now consider the two following sentences retrieving from texts:
They had excellent organic coffee available in the lobby.
I enjoyed starting the mornings with cinnamon latte and croissant.
None of the words “coffee”, “latte”, “croissant” or “mornings” can define the topic breakfast independently; as the case in the first sentence, but a combination of these words can tell us that the text might be related to the concept breakfast; as the second sentence.
Therefore, the concept breakfast can be defined by set of words like {tea, coffee, latte, bread, cheese, jam, morning,...}. You can start defining the concept by a few most necessary words. Then Explorer will show you more suggestions to be added to your concept. When you save your project as Full Excel or Full CSV (see 9 “Save as” Button and Exporting the Result of your Analysis), Explorer analyzes your data with respect to your target concepts, and tells you the number of present terms relating to each concept for each text. It will also provide sentiments scores related to your target concept.
7.1 How to Create, Edit and Use Concepts
To start creating a new concept or editing the old ones, you can click on My Concepts in Explorer navigation bar to be redirected to concepts page. In this page you can see the list of all of your concepts that you have previously created. To create a new concept, click on Create concept button. You will be then redirected to your new concept’s page. Give a name to your concept by writing it in the “Concept name” text field and select the language of your concept. Add terms to your concept by writing them in “Keywords” text field and add them by pressing the add button. When you are done with adding the most necessary terms for your concept, press the Create Concept (and get suggestions) button to save your concept and get new suggestions.
8 Models in Gavagai Explorer
You can save a project in Explorer as a model and then apply the model as a template for other projects. Using models is a suitable approach when you analyze similar types of data frequently and you have same concerns in your analysis; for example, you are looking for the same topics or themes. Here we explain models in Explorer and we guide you through creating and using them. However, if this is the first time that you are reading this document, we recommend you to skip this section for a little while and return to it after reading other parts of the document.
A model consists of your specific settings in a project; meaning grouped topics, merged topics, pinned groups and topics, and your ignored terms. When you apply a model on a project, the project current model will be replaced by the new one. Therefore, if you are unsure, you would better save the current model first.
Note that to apply a model to your project, the project’ file does not need to have the same specifications as the model’ source file (e.g. same columns or same number of texts, etc.).
8.1 Creating and Applying a Model in Explorer
8.1 Create Models from Projects
You can create a model from a project by selecting Model under Save as drop-down menu in the working panel.

8.2 Upload Models
You can also upload a model from your computer and use it in different projects. The Upload Model button can be found in My Models page.
8.3 Applying a Model to a Project
To apply a model to your project in Explorer, you can find the model under Apply the model drop-down menu in configuration panel. Another way of applying a model to your project is to find the ID of another project from the browser's address bar (the last segment in the URL), and enter it in the provided text field.

9 “Export as” Button and Exporting the Result of your Analysis
After each iteration and before you make any changes to your project, Explorer provides a Save as button where you can save the current result of your analysis in different formats. Under Export as drop-down menu there are 4 options; PDF, Excel, Full CSV and Model.

If you want to have a brief report of your analysis similar to what you see in Explorer GUI, you can save your project as either PDF or Excel. In case you want to have a detailed result of your analysis with respect to individual texts, you can choose Excel or Full CSV.

When you choose the format, a message box will pop up (next figure). You can either choose to be redirected to the project edit page where you can download your file or you can do it later by pressing Ok. The project edit page can be accessed from Explorer homepage (My Projects page) by clicking on Edit page button for that Project as on the figure below.

9.1 Save as Excel and Full CSV
When you download the result of your analysis as Excel or Full CSV, you will have a Excel or CSV file containing your original data appended by the analysis result from Explorer. Explorer performs a row based analysis of your data in respect to your pinned topics, target concepts and sentiments, and for each text it adds the result of the analysis to the corresponding row. In the following we explain the appended columns.
9.1.1 Pinned Topics
The first added columns are the columns regarding to your pinned topics. You can see the name of each pinned topic in a header of a column. A cell in a topic column contains 1 if the corresponding text includes that topic, and 0 otherwise.
9.1.2 Sentiments
The next added columns are the ones containing sentiment scores. Explorer measures 8 standard sentiments for each text; they are: SENT: DESIRE, SENT: FEAR, SENT: LOVE, SENT: POSITIVITY, SENT: SKEPTICISM, SENT: NEGATIVITY, SENT: HATE, SENT: VIOLENCE. You can see their names on the header of the columns. Each cell in a sentiment column contains the score of that sentiment for the entire corresponding text. In case you have selected a Target Concept for the analysis of your project, the sentiment scores will be restricted to the sentences that contain at least one of the terms in any of those concepts.
9.1.3 Target Concepts
The next columns are the target concepts that you have chosen to include in the report. For each target concept there is a column in the Excel file having the concept name in its header. Each entry in a concept column is the number of distinctive terms in that concept that are included in the corresponding text.
9.1.4 Keywords
The next columns in the report are the keywords columns. Keywords are those terms that best describe the subject of the texts. There are 4 different keywords columns in the Excel report:
The first column is “Keywords”. Explorer identifies the most significant keywords in each text and inserts them in the corresponding entry of this column in form of [keyword 1, keyword 2,…,keyword n] where the value of n can be different for different texts.
The second column is “Qualified Keywords”. Each entry in this column is a list containing those keywords from the previous column (means the “Keywords” column) that a Wikipedia page exists for them. Explorer considers these keywords as qualified keywords.
The third column is “Expanded Keywords”. Each entry in this column is a list containing the semantically similar words to the keywords of the corresponding text.
The fourth column is “Qualified Expanded Keywords”. This column contains those terms from previous column that have been qualified by Wikipedia as before.
The last column is “Summary”. This column contains the most significant sentences in the texts.
9.1.5 Sentiments Per Topic
For a selected topic, you can gauge the sentiment in each individual text and add a column for each sentiment to the report. For instance, if you select a topic after clicking the Export as Excel or CSV dialogue box to bring up the Configure Report Box, each text in your project will be analyzed with respect to the Positive, Negative, and Skepticism sentiment around the topic, and the columns for the sentiment scores of the specific topic(s) chosen will be added to the resulting Excel file under the name Sent: Positivity(topic name).
This is useful when you want to compare the positive sentiment score of the verbatim – located in the usual column called SENT: POSITIVITY. With the topic's positive sentiment score – located in the new appended column called SENT: POSITIVITY (*what ever topic you chose*). For example, if your topic's positive sentiment score is very large and almost as large as your verbatim sentiment score. Then there is a strong indication that the topic is driving the positivity of the verbatim.
*note adding a lot of topics to analyze will add thee columns per topic. Thus, the report generation time will be affected, the more topics are selected.
The Sentiments per topic and per verbatim are used in the Driver PDF report.
9.2 Drivers (PDF) – Satisfaction Drivers Visualization
When you download the results as a PDF. You will get a X-Y Scatter plot with overall satisfaction on the Y axis, the driver satisfaction on the X axis. Each plot on the graph is a satisfaction driver that is a result from the text analysis which is a topic and their associations. The driver satisfaction score is from the sentimental analysis score of the topic and the association. The overall satisfaction score is the sentimental analysis score of the text where the topic and association appears. (See see 4.3 Sentiments Analysis.) The correlation is between the driver's satisfaction and the overall satisfaction of the text. Drivers with high correlation imply that they "drive" overall satisfaction.
9.3 PDF
This is a PDF report that mirrors the web application. It will show the Groups, Topics, Terms that build up a Topic, and the Associations for each Topic. This is useful way to share the report.
10 Adding Data to your Project
In Explorer you can add data (more texts) to an existing project by uploading a new Excel/csv file in the project edit page. The file needs to have the same columns as the one you initially uploaded and should not contain a header column. You can also see your upload history on this page.
11 Payment System
Gavagai Explorer offers two different types of payment methods: credit card payments and invoicing. Per default you will be asked to submit your credit card details if you want to continue using Explorer after your trial period. If you contact our customer support, we can also set up invoice payment for you.
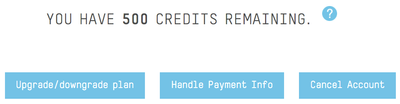
11.1 Credits
Each row in your uploaded file corresponds to one credit on your account. As soon as you hit the 'Explore' button for the first time, the credits will be drawn from your account. You can check your current amount of credits on the "My account" page.
11.2 Plans
Your account will be autmatically assigned to the explorer-500 plan, but you can always choose a plan that suits your exact needs. The price per credit depends on your current plan. Plans are updated on renewal, but if you want to change you plan immediately, you can contact support and we will help you with it.
11.3 Overage
If you don't have sufficient credits to explore a new project, you can buy them on a per project basis. Just create and explore a project and you will be presented with the option if your current credits are not enough. This gives you the opportunity to buy additional credits at the same price per credit as your current plan.
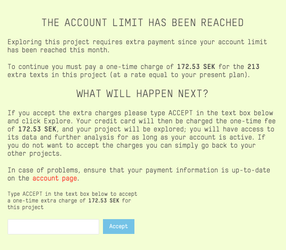
Enter the word "ACCEPT" into the text field and click on the "Accept" button to accept the charges. You will be charged immediately if you have a linked credit credit card. If you are paying by invoice, the charges will be added to your next statement.
12 Sharing Credits by Managing Users
You can collaborate with other users and share your credits with them. This way, all of your colleagues or partners can use their own Explorer accounts, but only one of the account has to provide billing information and will get charged.
12.1 Inviting Users
You can invite other users via the "My Account" page. Scroll down until you see the following, and click on "Invite user" to invite another user to be managed by you. This user will then get a notification via e-mail and can accept the invitation when they log into their account.
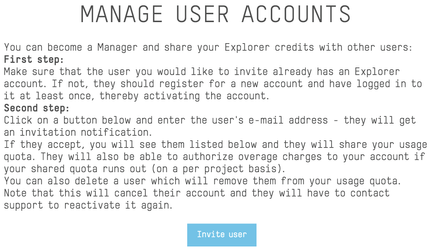
12.2 Disconnecting Managed Users
On the same page, you can also remove managed users.
12.3 Disconnecting from Manager
As a managed user, you can go to your "My account" page at any time and disconnect from your manager.
13 The API
If you are a developer and want to access Explorer's API, you can do so with the credentials from the Explorer web application. You don't need anything else, so no API key, etc.
Here you find the developer documentation: Gavagai Explorer API Documentation
For a tutorial on how to get started with the API, refer to this page: Gavagai Explorer API Tutorial
...
| hidden | true |
|---|
...
The documentation has moved here.